

Facts are current to 8 October 2026.
Bottom line up front
Crude oil is dear, but diesel costs more mainly because the world is short of refined fuel. Gulf crude exports largely recovered, with much moving by pipeline around Hormuz. Gulf refined fuels, including diesel, remain low because ships avoid the strait and refineries are damaged. Saudi crude piped to the Red Sea then meets the Houthi blockade at Bab el-Mandeb, the Red Sea's southern strait, so it takes longer routes. A return to pre-war pump prices by 5 November is highly unlikely in New Zealand, Australia, the United States and the United Kingdom.
Introduction
This edition follows diesel from the oil field to the pump, through two sea routes. The war began with US and Israeli strikes on Iran on 28 February. Radio warnings to ships in Hormuz began that day, and an Iranian military adviser declared it closed on 2 March. The outlook covers 8 October to 5 November.
From the well to the pump
Crude oil is oil from the ground. A refinery heats oil so its parts turn into gas at different temperatures. It can break heavier parts into petrol (gasoline in the US), diesel and other fuels.
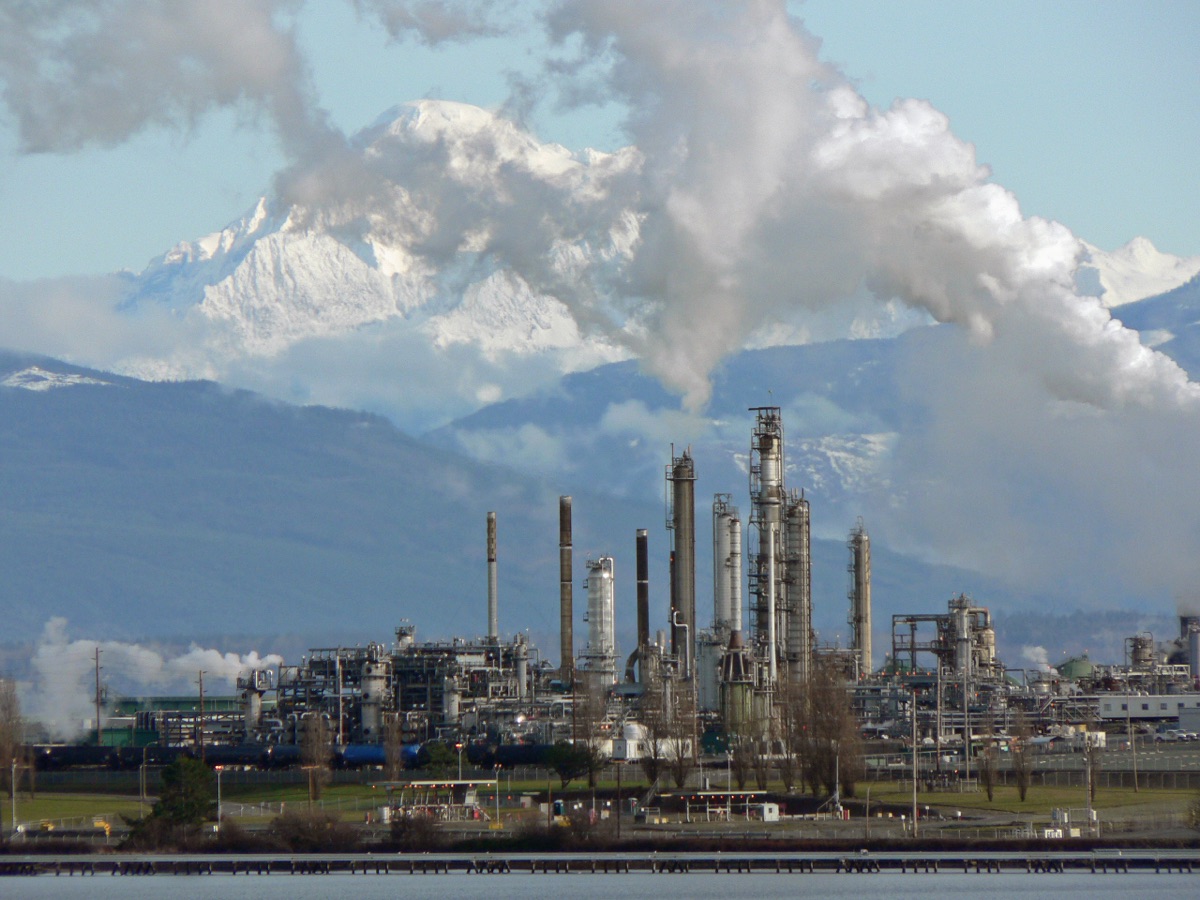
An oil refinery at Anacortes, Washington, in the United States, in January 2008. Photo: Walter Siegmund, Wikimedia Commons, CC BY 2.5.
A pump price has four parts: crude oil, refining, delivery and retail, and tax.
The Ministry of Business, Innovation and Employment (MBIE) tracks New Zealand fuel prices. For 2 October, our analysts split MBIE's import cost using its crude price.
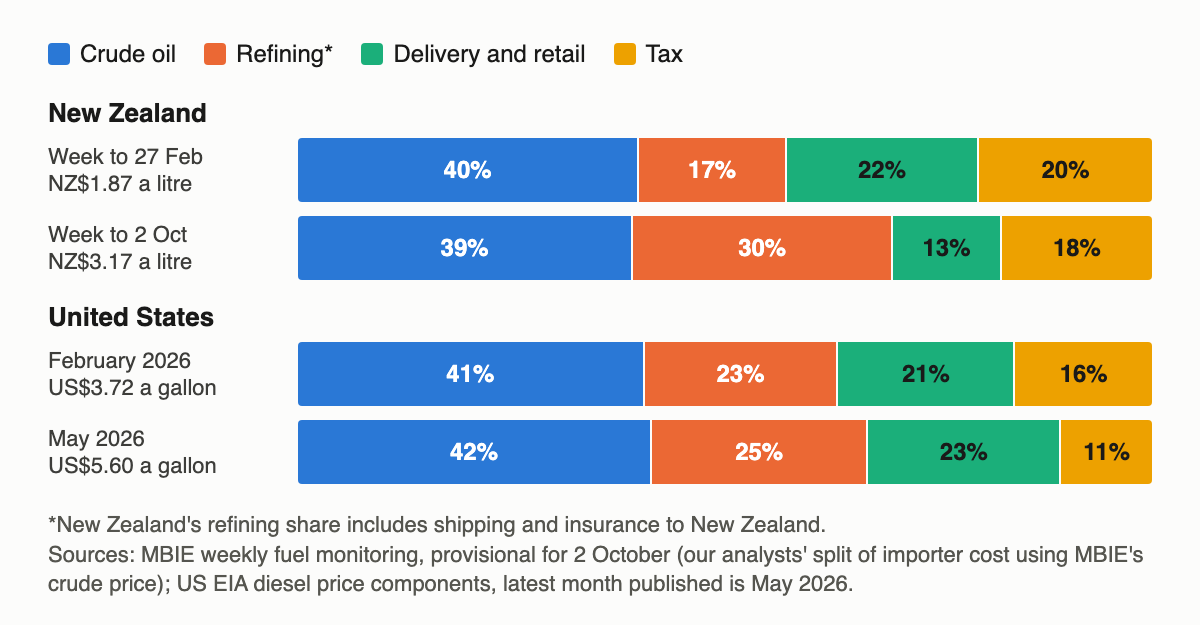
Where the money goes in a litre of diesel, New Zealand and the United States, before the war and now. New Zealand's refining share includes shipping and insurance. Chart: our analysts, from MBIE weekly fuel monitoring (to 2 October, provisional) and US EIA price components (to May 2026).
Why diesel costs more than petrol
Middle distillates include diesel, heating oil and jet fuel, and the US Energy Information Administration (EIA) says diesel and jet-fuel prices often move together. A US refinery gets 11 to 13 gallons of distillate from a 42-gallon crude barrel, and most becomes diesel.
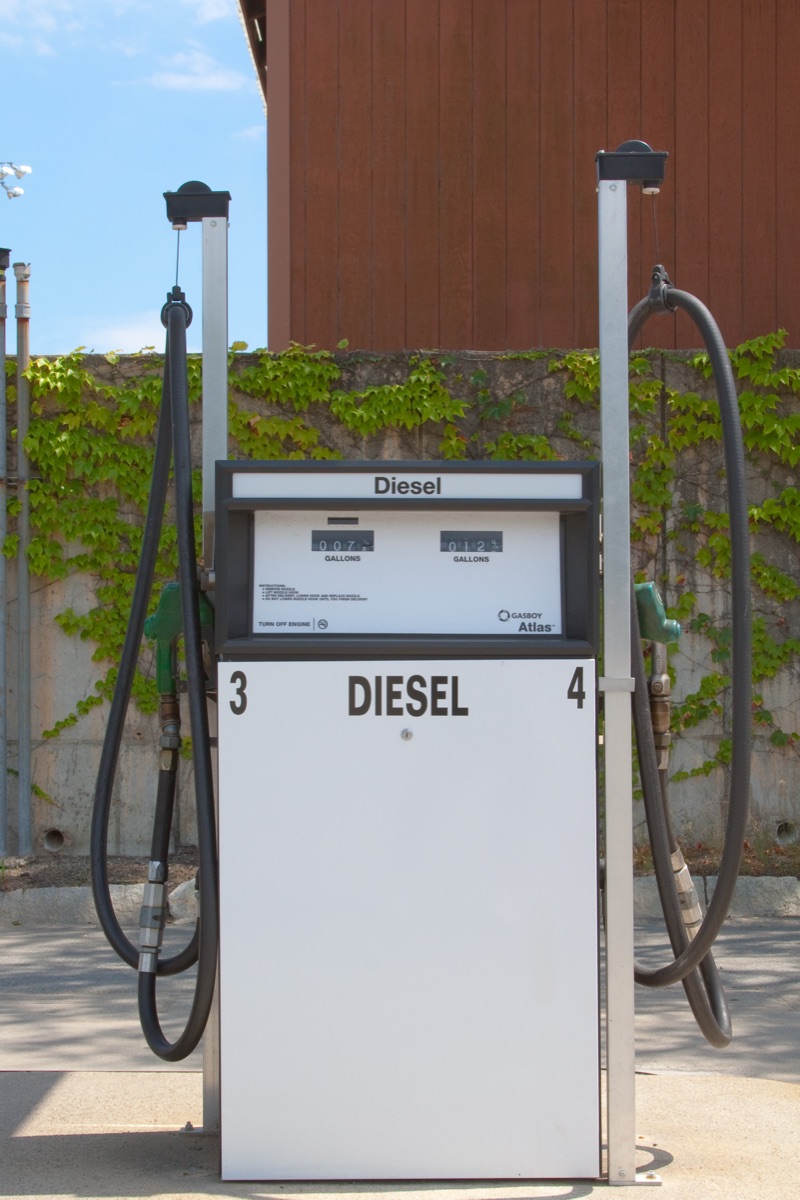
A diesel pump in Massachusetts, in the United States, in August 2010. Photo: jon collier, Wikimedia Commons, CC BY-SA 2.0.
The EIA says transport used about 75% of US distillate in 2025, and the International Energy Agency says trucks used half the world's diesel in 2017.
New Zealand's only refinery became an import and storage site in April 2022. Sites in Scotland, England, Germany and the United States stopped refining crude between 2025 and early 2026.
A refining margin is the gap between crude cost and product income, and the crack spread is the gap between diesel and crude prices. On 18 September, the EIA said US refineries ran at 97% of capacity, while stored distillate was 13% below the five-year average.
That tight supply helps diesel cost more than petrol, and our analysts calculated the New York Harbor diesel crack at about US$73 a barrel on 6 October. It was about US$41 a barrel on 27 February.
The Strait of Hormuz
A chokepoint is a narrow sea passage that a large share of trade must use. In 2025, Hormuz carried 19.87 million barrels of oil a day, including 4.93 million barrels of refined products, about one quarter.
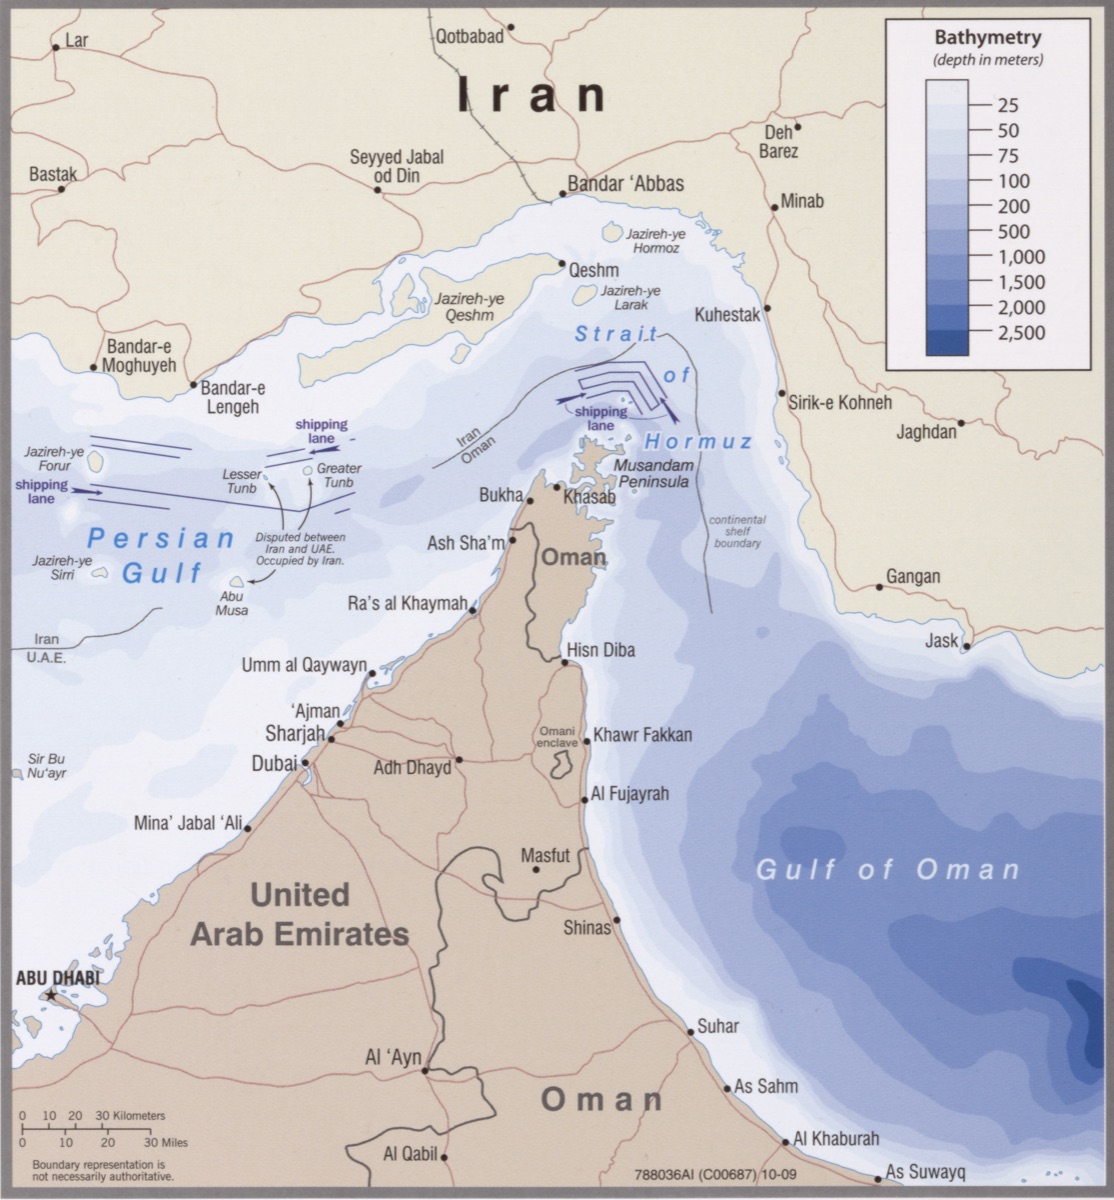
The Strait of Hormuz and its shipping lanes, from a CIA map published in October 2009. Map: US Central Intelligence Agency, October 2009. Public domain.
Iran declared the strait closed on 2 March after radio warnings began on 28 February, and shipping firms suspended crossings. Some insurers cancelled war-risk insurance, which covers war damage or the taking of a ship. At least 12 tanker attacks were reported from 28 September to 5 October, and the International Maritime Organisation recorded 9 incidents that week.
A blockade uses naval forces to stop ships entering or leaving ports. The US blockade began on 13 April and resumed on 14 July. It covers Iranian ports, while other ships may cross Hormuz. Vortexa said Iranian crude loadings fell from about 2 million barrels a day earlier in 2026 to about 210,000 in August.
Strikes damaged or shut refineries including Ras Tanura, Sitra, Mina al-Ahmadi and Al-Zour. The International Energy Agency said closed Gulf refineries could otherwise process nearly 3 million barrels of crude a day.
Kpler found crude exports above pre-war levels on four of seven days in late September. About 40% of Middle East exports now use pipelines around the strait, up from 17% before the war. Refined products, including diesel, recovered far less.
A bypass pipeline carries oil around a blocked sea route, and Saudi Arabia's East-West pipeline carries crude from Abqaiq to Yanbu on the Red Sea. The United Arab Emirates' crude Habshan-Fujairah pipeline ends on the Gulf of Oman. The Oxford Institute for Energy Studies says Yanbu can load only about 900,000 barrels a day of products.
Kpler counted 677,000 product barrels a day through Hormuz in late September, against 3.6 million before the war. On 4 October, International Monetary Fund PortWatch counted 4 crossings against 85 a day before the war, while Windward counted 13 against about 135.
Bab el-Mandeb and the Houthis
Bab el-Mandeb is the strait at the Red Sea's southern end, between Yemen and Africa, and is the second chokepoint on the Gulf-to-Europe route. The Houthis are an Iran-backed armed group operating along Yemen's Red Sea coast.
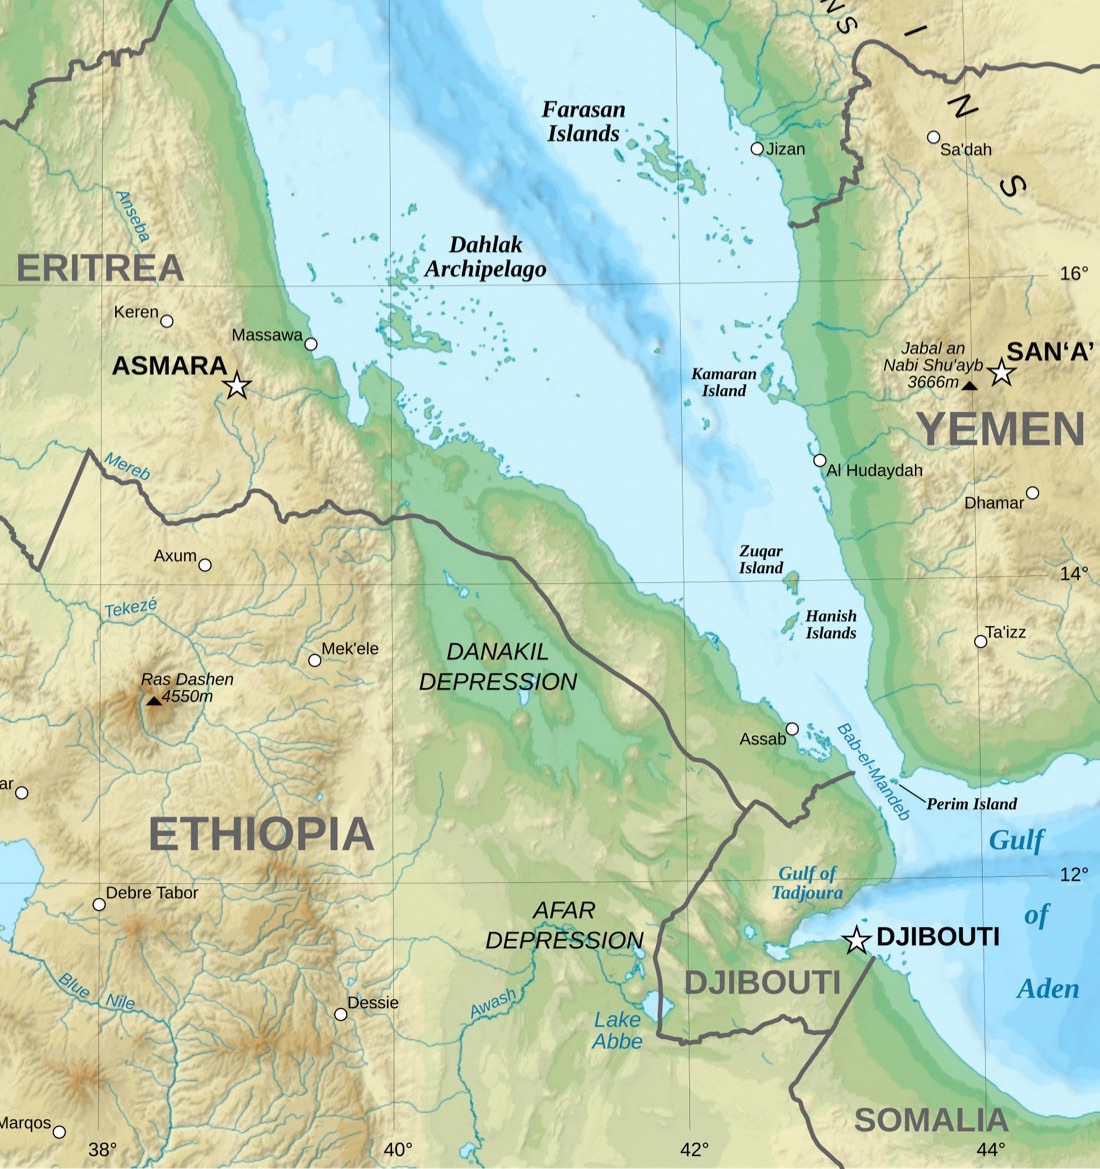
The southern Red Sea, Yemen's coast and the Bab el-Mandeb strait. Map: Eric Gaba (Wikimedia Commons user Sting), CC BY-SA 4.0, cropped.
The Houthis declared a blockade of Saudi shipping and ports on 20 July, while other traffic kept crossing. ACLED records conflict events and reported attacks on 10 commercial ships between 13 July and 25 September. Most were tankers, but ACLED found no corroborated attack after 24 August.
From International Monetary Fund PortWatch data, our analysts calculated 26.6 ships a day through Bab el-Mandeb in September, against 74.6 from January to October 2023 before the Houthi campaign.
The East-West pipeline ends at Yanbu, so oil bound for Asia must pass Bab el-Mandeb or take the long route. As of 26 July, Kpler reported no new Saudi crude loaded there for shipping south since the blockade, and Saudi cargoes went north through the Suez Canal instead.
Ras Tanura to Rotterdam is 10,358 km through Suez and 17,975 km around Africa's Cape of Good Hope. UN Trade and Development estimated in 2024 that this route adds 10 days to two weeks between Asia and northern Europe. Longer journeys tie up ships and delay fuel reaching Europe.

Hormuz and Bab el-Mandeb show how geography shapes what ships and armed forces can do. Build the Battlespace is a free three-part workshop on using military intelligence techniques to understand the battlefield. It runs on 12, 14 and 16 October 2026, and every part is recorded. Registration closes on 17 October.
Ships, insurance and freight
The Financial Times reported war-risk insurance charges of 6% to 10% of ship value on 7 October and put one supertanker voyage at up to US$20 million to insure.
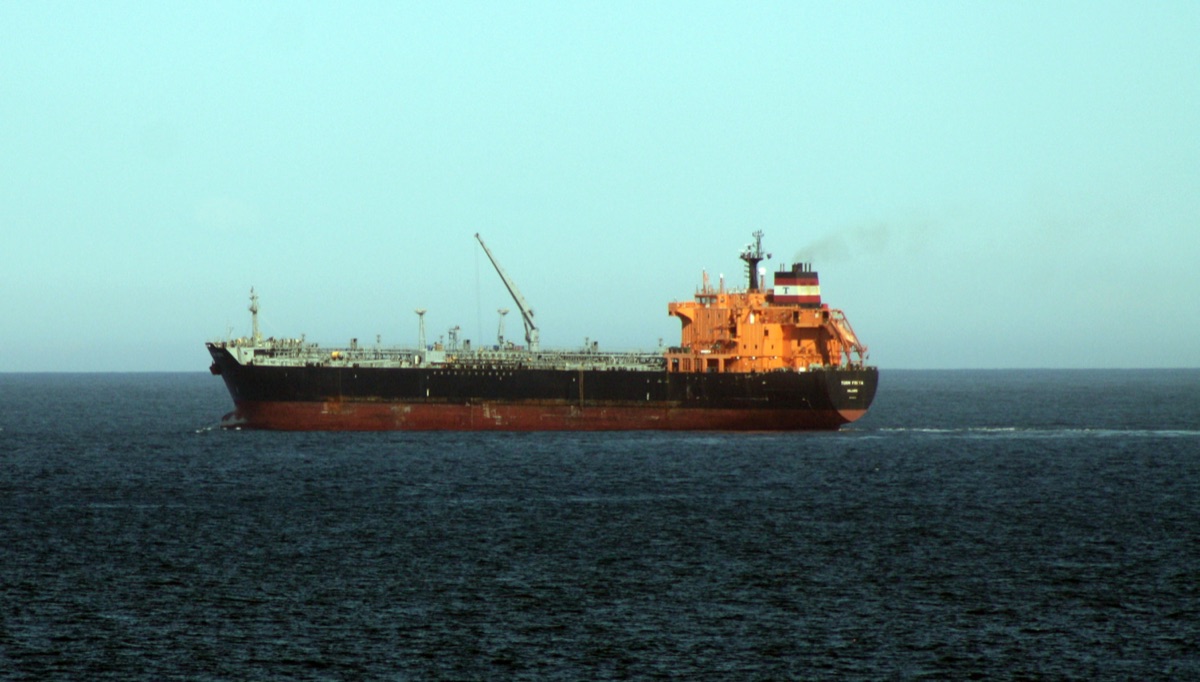
The oil products tanker Torm Freya at sea off South Africa in March 2015. Photo: Bob Adams, Wikimedia Commons, CC BY-SA 2.0.
A freight rate is the price to carry cargo by ship. Baltic Exchange assessments put a Gulf-to-Europe voyage at US$4.05 million on 13 February, and it reached US$17.27 million on 25 September, about 4.3 times higher. Shipping is part of New Zealand's fuel import cost, so higher charges raise it, but no verified source gives the extra cost per litre.
Currency and tax
Oil is priced in US dollars, so a weaker local currency raises its cost. On 7 October, NZ$1 bought US$0.56175 and A$1 bought US$0.6970, while on 6 October £1 bought US$1.3279. Our analysts calculated falls of about 6%, 2% and 1% against the US dollar since 27 February.
Excise is a tax on each unit of fuel. The United Kingdom charged 52.95p duty per litre, then added 20% value-added tax on purchases. New Zealand charged no diesel excise at the pump.
Its 2 October price included 13.94 NZ cents linked to fuel emissions and 0.90 cents in other government charges. Goods and services tax (GST), a tax on purchases, was 41.36 cents.
Road user charges pay for distance driven. In 2026, New Zealand two-axle light diesel vehicles up to 3,500 kg paid NZ$76 per 1,000 km, including GST.
The price at the pump
National series show diesel well above late-February prices.
| Country | Price per litre (local) | US$ per litre (our conversion) | Date | Change since late February |
|---|---|---|---|---|
| New Zealand | NZ$3.1707 | US$1.78 | Week to 2 October | 69.4% |
| Australia, AIP series | A$2.847 | US$1.98 | Week ending 4 October | 58.0% |
| United States | US$1.64 | US$1.64 | 5 October | 62.7% |
| United Kingdom | £1.9952 | US$2.65 | 5 October | 41.0% |
The US price is converted from a per-gallon figure. Tax was 43.2% of the UK price on 5 October and 10.7% of the US price in May.
Who feels it most
Infometrics put New Zealand's three-month rise in road transport diesel costs at 53% by June 2026. UK fuel was about one-third of a road freight operator's costs on 20 September.

A farmer plants soybeans near Vincennes, Indiana, in the United States, in May 2021. Photo: Brandon O'Connor, US Department of Agriculture. Public domain.
Stats NZ's measure of farm fuel prices rose 42.4% in the three months to June.
Fuel can raise food prices through transport and farming, and New Zealand food prices rose 1.9% in the year to August. In September, the Reserve Bank said fuel was making food dearer. The UN Food and Agriculture Organisation's measure of international food prices reached 136.0 in September, its highest since November 2022.
The next few weeks
Using immediate-delivery prices for Brent, a crude-oil benchmark, our analysts calculated the New York Harbor diesel spread at about US$73 a barrel on 6 October. ING put the European futures spread, based on contracts for later delivery, at about US$73 a barrel after the G7 agreed to release stored oil and diesel. The New York spread is highly likely to stay above its pre-war level of about US$41 a barrel until 5 November. The baseline is our analysts' calculation because no published pre-war crack was found.
Two trackers counted 4 and 13 Hormuz crossings on 4 October. Iran requires its conditions before reopening, while Qatar says talks continue. Near-normal daily traffic by 5 November is unlikely. Counts differ, and oil volumes have recovered more than ship numbers.
Pump prices remain far above February. Wholesale prices, which suppliers charge sellers, reach pumps later. Pre-war prices by 5 November are highly unlikely. Each price comes from one weekly series. New Zealand's latest figure may be revised.
Kpler counted 677,000 product barrels a day through Hormuz, against 3.6 million before the war. Vortexa put Gulf-wide refined-product exports at 60% of their pre-war level in September. Goldman Sachs and the International Energy Agency estimate closed refineries could process 2 to 3 million barrels a day. Gulf refined-fuel exports are likely to stay below four-fifths of pre-war levels until 5 November. Trackers include different fuels and places, so pre-war totals range from 3.3 to 7.3 million barrels a day.
The Houthis declared a blockade of Saudi shipping on 20 July. Other ships crossed Bab el-Mandeb, but Kpler reported no new Saudi crude loaded to go south. Saudi crude from the Red Sea is likely to go north through Suez until 5 November. Kpler is the only route source, and its last dated report is from 26 July.
A US-Iran deal reopening Hormuz would change these judgements. It would not by itself end the Houthi blockade of Saudi shipping. A deal before 5 November is unlikely because Iran's seven conditions and Vice-President Vance's demand for lower enrichment capacity remain unresolved. President Trump said on 22 September that he expected a deal after the 3 November election.
| Indicator | Where it shows up | Why it matters |
|---|---|---|
| New York Harbor diesel-minus-Brent spot calculation falls towards US$41 a barrel | EIA immediate-delivery prices; ING's European series is separate | A smaller gap between diesel and crude prices. |
| Daily Hormuz ship crossings rise towards pre-war levels | IMF PortWatch and Windward reports | Ships are returning. |
| No tanker attacks reported in or near Hormuz for a week or more | UK Maritime Trade Operations and Joint Maritime Information Centre shipping-security reports | Lower immediate risk. |
| The amount of crude processed by Gulf refineries and diesel exports recover | International Energy Agency report; Kpler and Vortexa data | More refined fuel. |
| Negotiators publish an agreement, or the blockade is lifted | Qatar briefings and US Central Command statements | Hormuz and Iranian ports could reopen. |
ENDS

Responses